

Q2/2025 earnings season starts - Preview of the week starting 07Jul25

Public Holidays
There are no public holidays in China, Singapore, America or Hong Kong.
Economic Calendar (07Jul25)

Economic Outlook (from Grok)
Energy Market:
The prior crude oil inventory build (3.845M) suggests an oversupply. If this trend persists, oil prices may soften, potentially easing inflationary pressures. A reversal to a drawdown could tighten supply and support higher prices.
Monetary Policy:
The FOMC Meeting Minutes will be a key focus. Any indication of a hawkish stance (e.g., plans for rate hikes) could strengthen the U.S. dollar and pressure equities, while a dovish tone (e.g., rate cuts) might boost risk assets. Markets will scrutinise the Fed’s view on inflation and labour market strength.
Bond Market:
The 10-year and 30-year Note Auctions will reflect investor demand. Higher yields (above 4.421% and 4.844%) could signal inflation concerns or growth expectations, impacting bond prices and long-term borrowing costs.
Market Implications
Equities: A dovish FOMC Minutes could lift stocks by reducing rate hike fears, while a hawkish tone or rising oil inventories might weigh on sentiment. Stable jobless claims should provide a neutral backdrop.
Bonds: Higher auction yields or hawkish FOMC Minutes could push Treasury yields up, pressuring bond prices. A softer oil inventory build might support lower yields.
Commodities: Oil price movements will hinge on inventory data, with builds potentially capping gains and drawdowns driving prices higher.
The outlook for the week is cautiously balanced, with the FOMC Minutes as the central event. Stable labour market data (235K claims) and potential oil inventory builds suggest controlled inflation, but any hawkish Fed signals could introduce volatility. Bond auctions will offer additional clues on market sentiment.
Notable Highlights
Initial jobless claims will be announced. Initial Jobless Claims at 235K suggest a stable labour market. A rise above this level could hint at weakening conditions, potentially influencing Fed policy expectations, while a drop might reinforce labour market resilience. This weekly report tracks the number of new unemployment claims, serving as a leading indicator of labour market health. The Federal Reserve uses this as one of the key macro data references as it balances inflation and employment in the economy.
Crude Oil Inventories can be seen as forward indicators of market demand and consumption. This event tracks the weekly change in U.S. crude oil inventories, a key indicator of oil supply and demand that can impact oil prices and energy markets. If the trend of excess inventories continues, demand erosion can lead to reduced production & weakened consumer spending.
Earnings Calendar (07Jul25)

I am interested in a few of the coming earnings like Levi’s, Delta and Vista.
Let us look at Delta.

Technical Analysis has recommended a “Strong Buy” rating. The stock price has risen 11.8% from a year ago.
The analysis below is completed with inputs from Grok.
Revenue
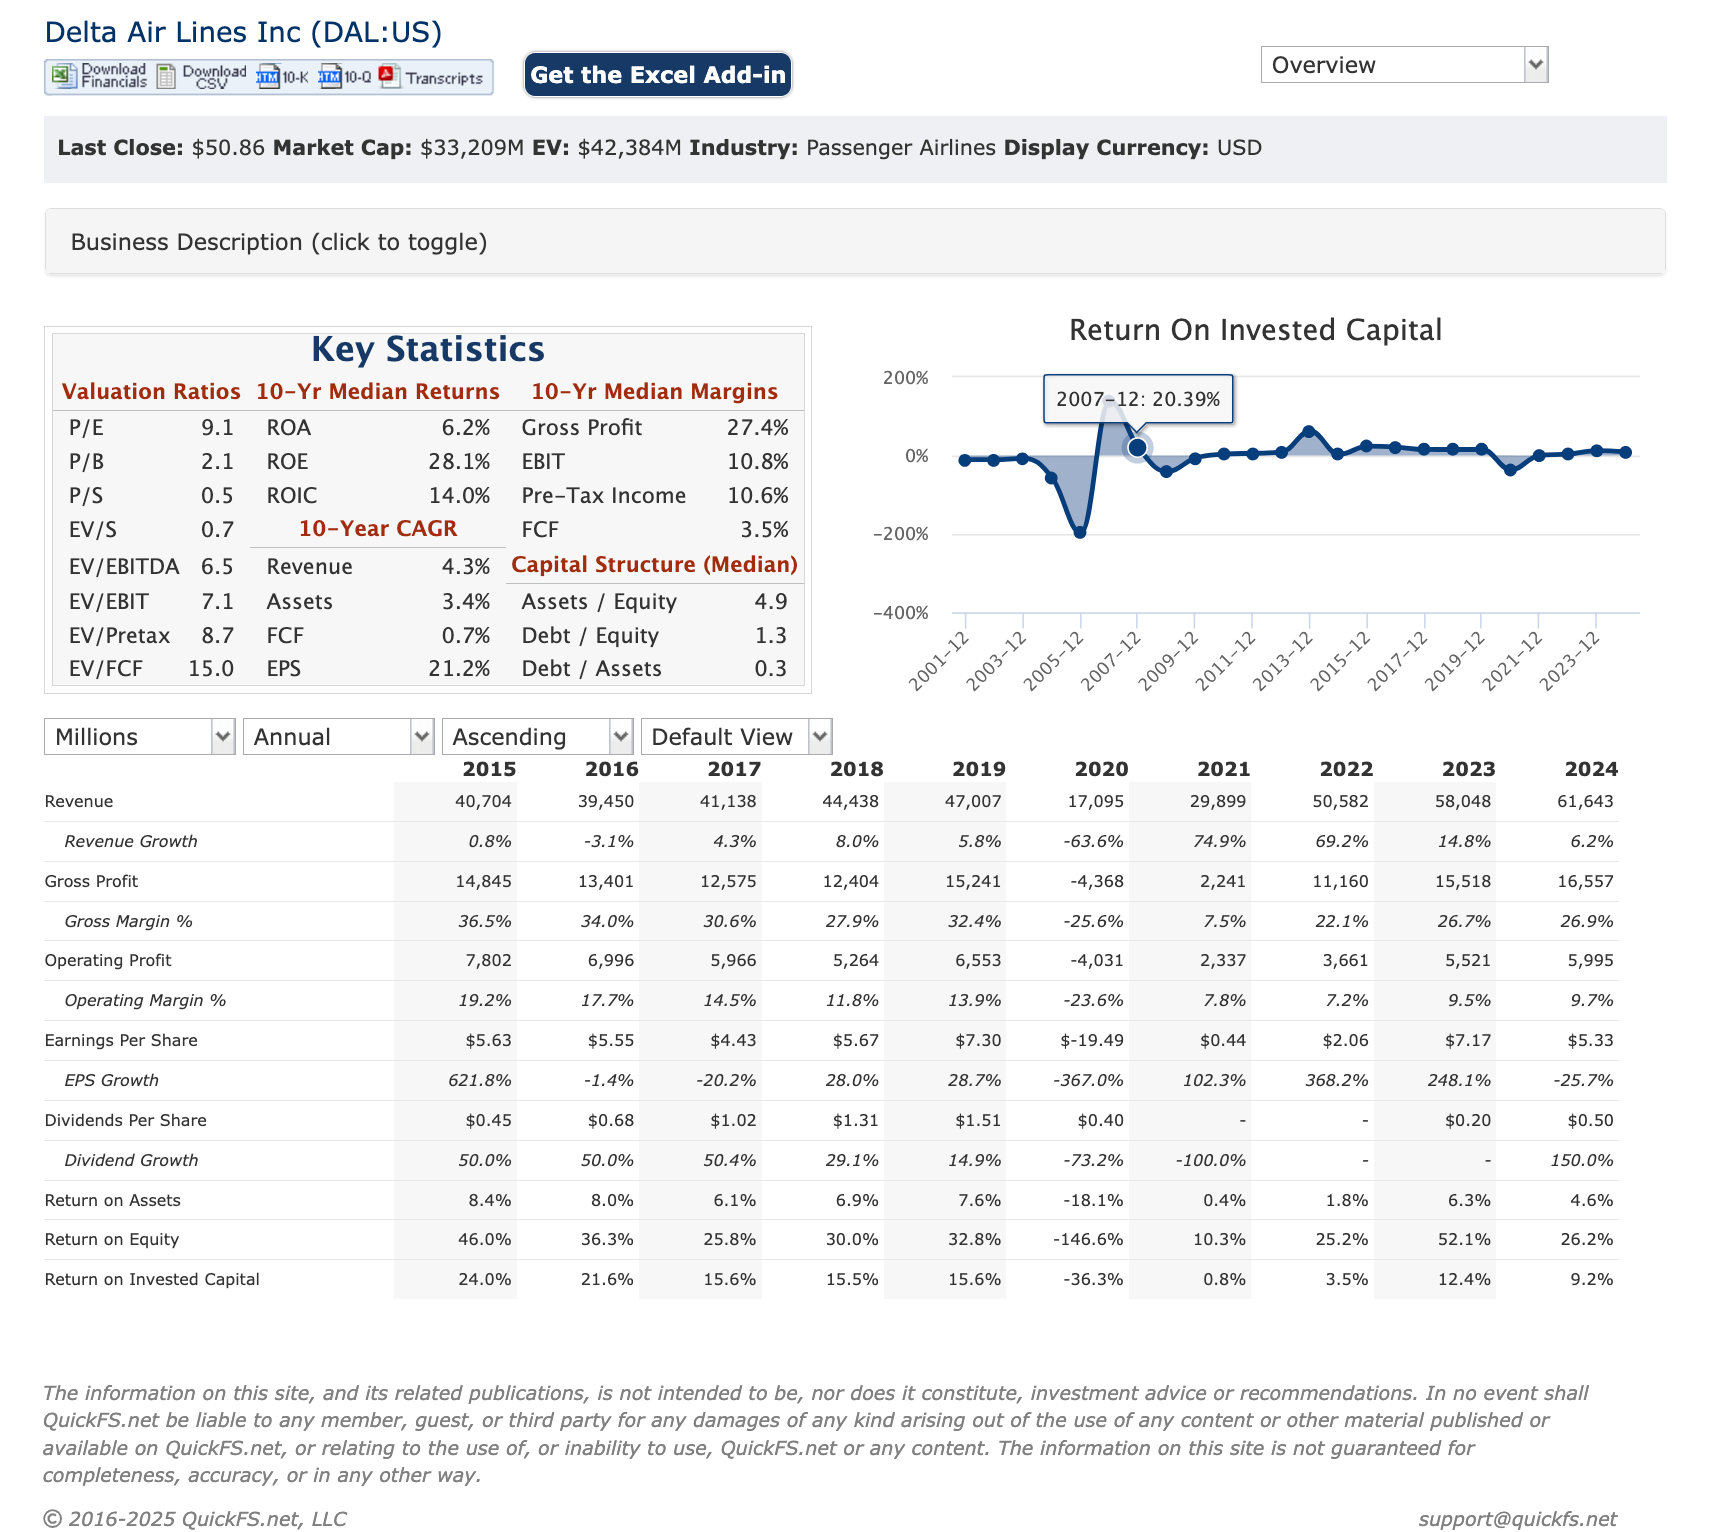
Growth Trend: Delta's revenue has shown a strong upward trend, increasing from $40.704 billion in 2015 to $61.643 billion in 2024. The 10-year compound annual growth rate (CAGR) for revenue is approximately 4.4%, reflecting steady expansion despite economic cycles.
Competitive Advantage: Delta’s consistent revenue growth highlights its strong position in the U.S. airline industry, supported by its extensive domestic and international network, premium offerings, and loyalty programs like SkyMiles.
Operating Profit
Growth Trend: Operating profit has fluctuated significantly, dropping from $7.802 billion in 2015 to a loss of over $4 billion in 2020 due to the pandemic, then recovering to $5.995 billion in 2024. The 10-year trend shows resilience.
Competitive Advantage: Delta’s ability to rebound from significant losses demonstrates operational resilience and cost management, bolstered by its diversified revenue streams and premium service model.
Earnings Per Share (EPS)
Growth Trend: EPS has been volatile, rising from $5.63 in 2015 to $5.33 in 2024. There were negative EPS during the pandemic years.
Competitive Advantage: The overall EPS growth, despite volatility, highlights Delta’s ability to generate shareholder value over time, supported by its strong brand and operational efficiency.
Price-to-Earnings (P/E) Ratio
Valuation: The P/E ratio is 9.1, suggesting Delta is undervalued relative to its earnings, aligning with the cyclical nature of the airline industry.
Competitive Advantage: The low P/E ratio and strong ROE reflect Delta’s efficient capital use and market perception of value, supported by its premium positioning and operational strength.
Overall Assessment
Over the past 10 years, Delta Air Lines has demonstrated resilience and growth, with revenue increasing at a 4.3% CAGR and EPS at a 21.2% CAGR, driven by its leadership in the U.S. airline market. Operating profits rebounded to $6.303 billion in 2024 after a significant loss in 2020, reflecting operational recovery. The company resumed dividends at $0.50 in 2024, and its P/E ratio of 9.1 suggests undervaluation. Modest FCF growth and a manageable debt profile support its financial flexibility. Delta’s competitive advantages include its extensive network, premium service offerings, loyalty program, and operational efficiency, positioning it well in the airline industry. However, its performance remains sensitive to economic cycles and fuel costs, as seen in the 2020 downturn, requiring continued strategic focus as of July 2025.

Delta Air Lines coming earnings have a forecast of $2.05 and $15.42B for the EPS and revenue, respectively.
From the above, Delta can be a good consideration for our portfolio. Let us invest based on our circle of competence and research before investing.
Market Outlook of S&P500 (07Jul25)

Technical observations:
MACD - a top crossover is completed, and this implies the uptrend should continue.
Exponential Moving Averages (EMA) lines are showing an uptrend.
Both the 50 MA line and the 200 MA line are showing an uptrend. This speaks of a bullish outlook for both the short and long term.
A golden cross is completed. This is typically a bullish signal when backed with strong volume.

The CMF is positive at 0.18, indicating more buying pressure over the past 20 periods.

The technical analysis shows a rating of “Strong Buy” from the daily interval, with 19 indicators showing a “Buy” rating, and none showing a “Sell” rating.

Here are the recent candlestick patterns.
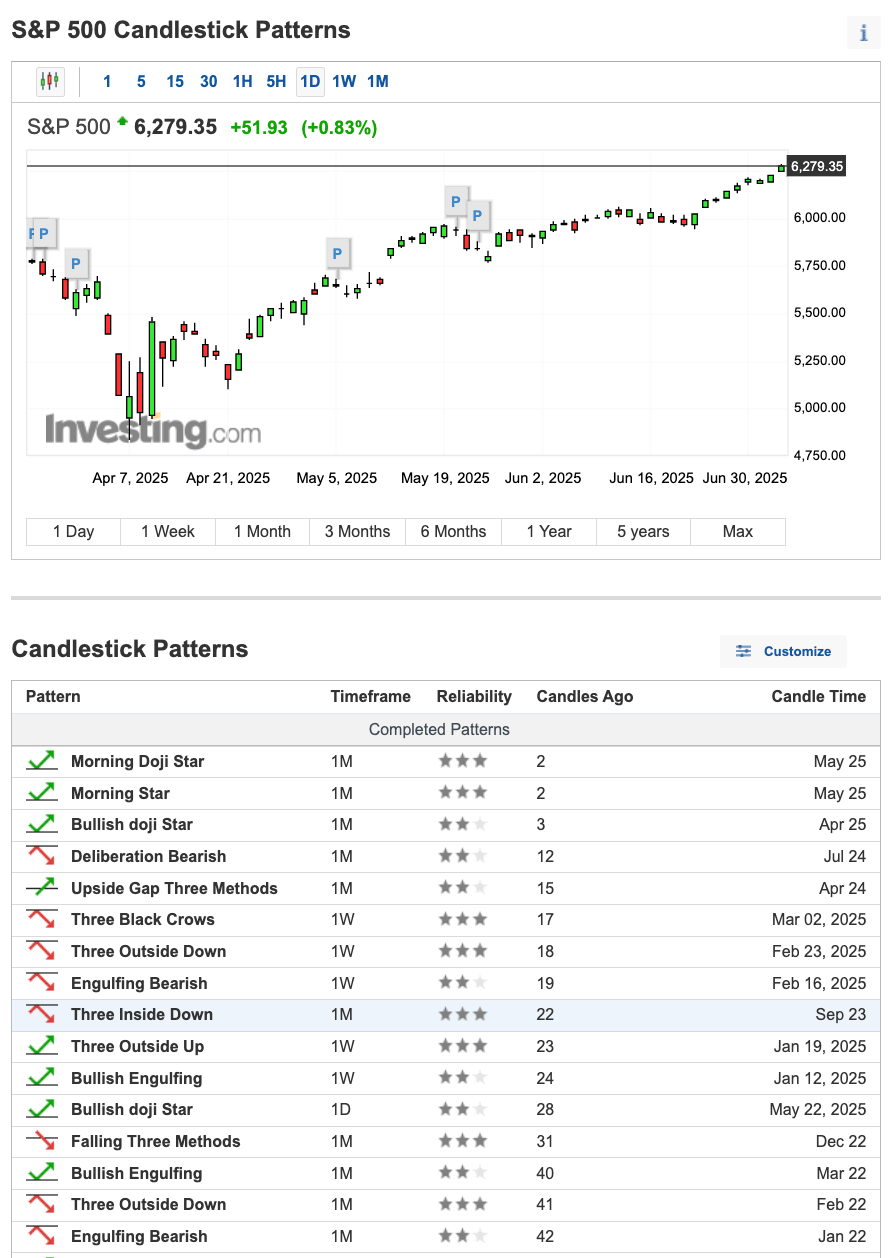
Outlook from Candlestick patterns (from Grok):
Short-Term Outlook: The S&P 500 is likely in a short-term bearish phase, driven by the Evening Star and Bearish Engulfing patterns from June 16. If the price has fallen further from 5,845.90 over the past three weeks (e.g., toward 5,796.34 or lower), the downtrend may continue. A potential bottom could form near the 200 MA (5,796.34), where a reversal pattern might emerge. Watch for increased volume or a bullish candlestick (e.g., Hammer or Morning Star) to signal a bounce.
Long-Term Outlook: The long-term trend is neutral, with the risk of turning bearish if the price breaks below the 200 MA (5,796.34) with strong selling pressure. The prior uptrend from 5,345.01 to 6,000.36 was robust, but the current correction could mirror the early 2025 decline if bearish momentum persists. A hold above 5,796.34 with new bullish patterns could restore the bullish outlook.
Actionable Insight: Given the bearish short-term trend, caution is advised. Monitor the price action around 5,796.34 (200 MA) for a potential support test; a bounce with high volume could signal a recovery toward 5,976.97 or 6,000.36. If the price breaks below 5,796.34, consider a deeper correction toward 5,629.83 (50 MA). Check recent candlestick formations (e.g., over the last week) and volume trends for confirmation, as the three-week gap limits precise tracking without new data.
The candlestick patterns suggest a bearish short-term outlook with a neutral long-term outlook, indicating the S&P 500 may be entering a correction phase following its recent high, with the potential for a trend reversal depending on support levels and new pattern formations.
The S&P 500 should continue its uptrend in the coming days. We can expect some reversal due to the double top.
News and my thoughts from the past week (07Jul25)
KEVIN O’LEARY: NY IS TURNING INTO THE AMERICAN NIGHTMARE "The money just leaves, the tax base leaves, the capital leaves, the developer leaves, the risk capital leaves, and you're left with a collapsing environment." - Fox News
Japanese insurers unrealized LOSSES are HUGE: The biggest Japanese insurers’ paper losses on their domestic bond holdings hit a record ¥8.5 TRILLION ($60B) in Q1 Nippon Life, the largest Japanese insurer and the world’s 6th-largest saw ¥3.6TN ($25B) loss - X user Global Markets Investor
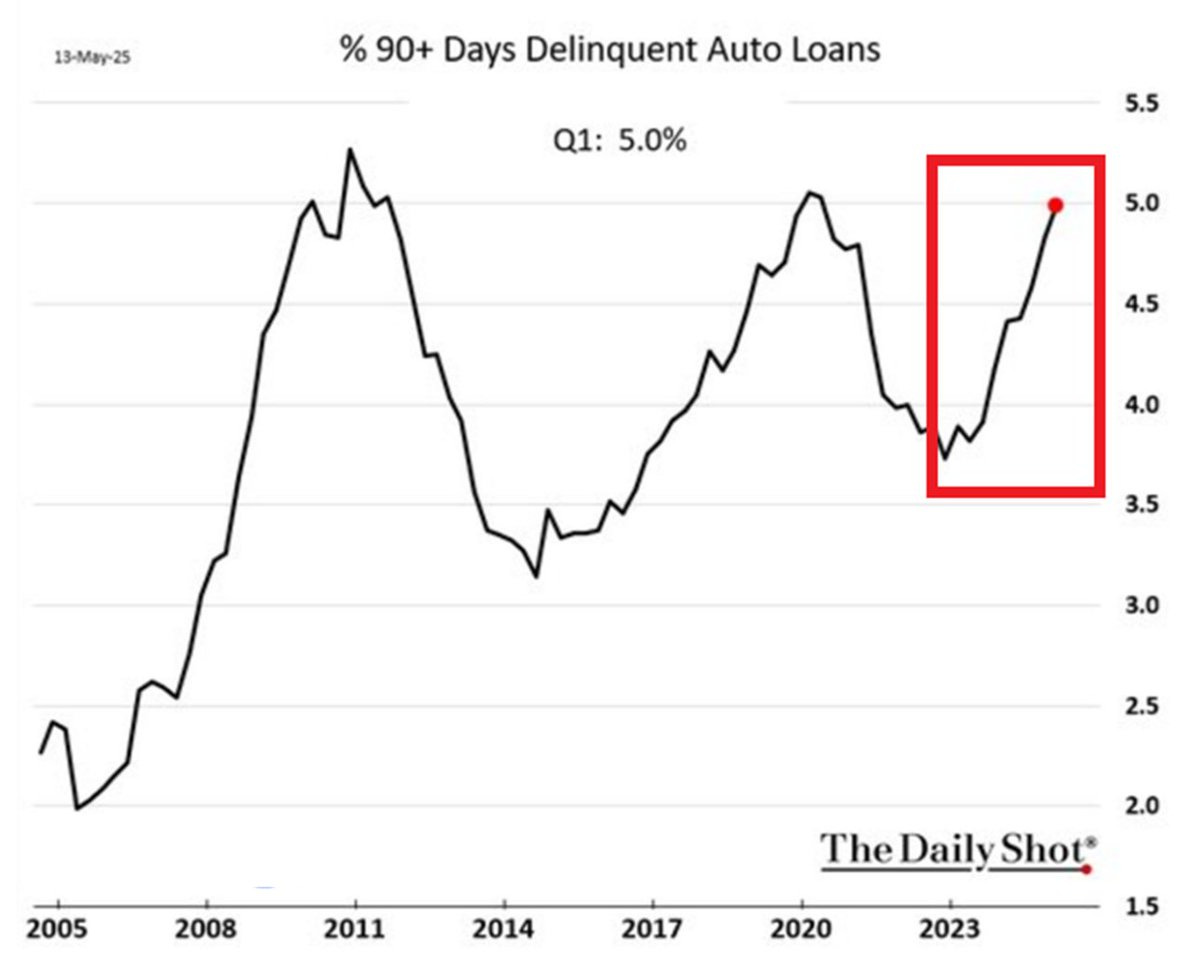
US consumers are FALLING behind on their debt: 20% of the lowest-income Americans' credit card debt was seriously delinquent in Q1 2025, the highest share in 14 YEARS. Nationwide, ~13% of credit card debt was past due 90+ days, the highest since 2011 - X user Global Markets Investor
“Tariffs are unlikely to result in much reshoring because production costs in other countries are well below the U.S.’ for most products (even after accounting for tariffs), and China will likely continue to grow its exports on the back of cost advantages and industrial policy support,” Goldman Sachs

Japan equity funds saw a RECORD $12 billion in net outflows last week. This brought the 4-week moving average of outflows to $4 billion, an all-time high. Have investors been moving money out of equities to Japanese bonds? - X user Global Markets Investor

Is Energy the next frontier?
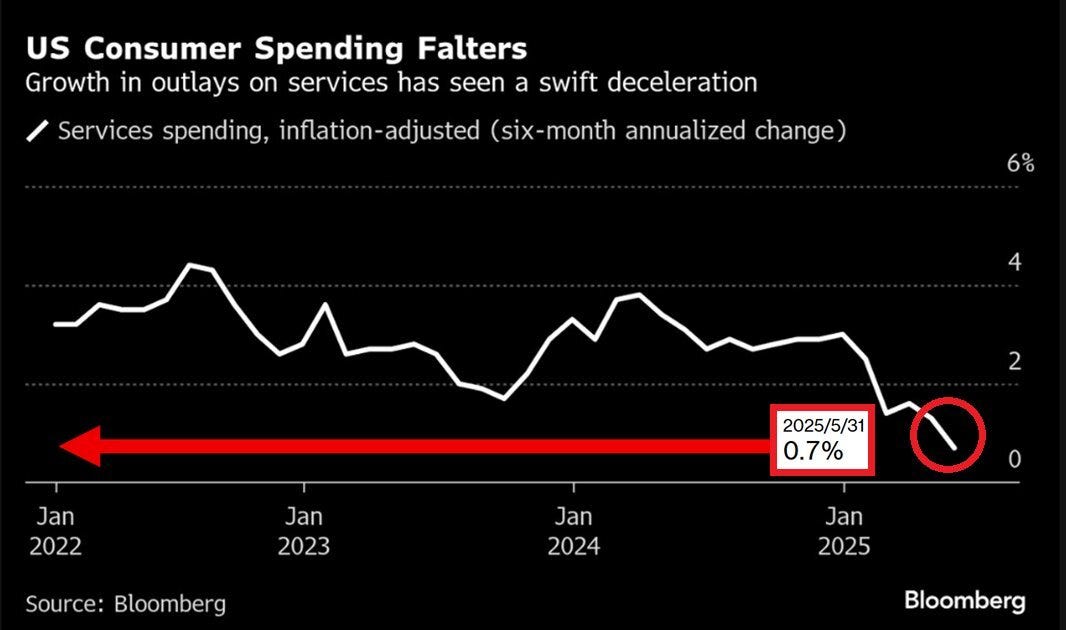
US Consumer Confidence fell sharply in June, to the 2nd-lowest in 4.5 YEARS. Expectations have dropped in 6 out of 7 months. Americans express growing concerns about tariffs and record prices - X user Global Markets Investor

A silent crash is unfolding and it’s towering over your city. Office buildings are vacant, mortgages are defaulting, cities are broke. This is bigger than you think.

U.S. Housing Market has reached its most unaffordable level in history - BarChart

Warren Buffett Indicator just hit 207%, the most expensive valuation in history Bullish? - BarChart

The delinquency rate on Commercial Mortgage-Backed Securities (CMBS) for offices jumped 49 basis points in June, to a record 11.1%. This has now officially surpassed the post-2008 high of 10.7% and the December 2024 peak of 11.0%. Since the start of 2023, the delinquency rate on CMBS for offices has skyrocketed by 9.5 percentage points. Last month, $1.8 billion in CMBS office loans fell into delinquency, while $1 billion in previously delinquent loans were resolved. Meanwhile, the overall US CMBS delinquency rate rose 5 basis points, to 7.13%, the highest in at least 4 years. The office sector is beyond bear market territory. - X user The Kobeissi Letter
The United Kingdom faces the largest single-year exodus of wealth ever recorded, per Forbes.
Trucking stocks are surging on expectations that the Big Beautiful Bill will accelerate freight demand in coming months. - X user Craig Fuller

The US government is currently paying a record $3.3 BILLION (daily) in interest on its public debt. The value has DOUBLED over the last 3 years as the federal debt has SKYROCKETED while the Fed raised its interest rates. Unsustainable fiscal path. - X user Global Markets Investor
My Investing Muse (07Jul25)
Layoffs & Closure news
June ends with third Illinois trucking company to file for bankruptcy Elma Transport files for Chapter 11 bankruptcy - Freightwaves
MICROSOFT TO LAY OFF AS MANY AS 9,000 EMPLOYEES IN LATEST ROUND OF JOB CUTS -THE SEATTLE TIMES


US-based employers announced 47,999 job cuts in June, bringing total Q2 2025 layoffs to 247,256, the highest Q2 total since 2020. Year-to-date, firms have announced 744,308 job cuts, the most for any first half of the year since 2020. Outside of 2020, this was the highest first half since 2009, when 896,675 cuts were announced. The government sector has led the surge with 288,628 layoffs, including federal and contractor reductions. Retail and technology sectors followed, with 79,865 and 76,214 job cuts, respectively. Economic conditions, closures, and restructuring have been the primary drivers. US layoffs remain elevated. - X user The Kobeissi Letter
The above are some news items about layoffs and closures. As tariff negotiations drag on, the collateral to businesses (especially smaller ones) can compound.
Big Beautiful Bill (BBB)
Here are some news and updates about BBB:
Now that the budget bill has passed Congress, we can see what the projections look like for deficits, government debt, and debt service expenses. In brief, the bill is expected to lead to spending of about $7 trillion a year with inflows of about $5 trillion a year, so the debt, which is now about 6x of the money taken in, 100 percent of GDP, and about $230,000 per American family, will rise over ten years to about 7.5x the money taken in, 130 percent of GDP, and $425,000 per family. That will increase interest and principal payments on the debt from about $10 trillion ($1 trillion in interest, $9 trillion in principal) to about $18 trillion (of which $2 trillion is interest payments), which will lead to either a big squeezing out (and cutting off) of spending and/or unimaginable tax increases, or a lot of printing and devaluing of money and pushing interest rates to unattractively low levels. This printing and devaluing is not good for those holding bonds as a storehold of wealth, and what’s bad for bonds and US credit markets is bad for everyone because the US Treasury market is the backbone of all capital markets, which are the backbones of our economic and social conditions. Unless this path is soon rectified to bring the budget deficit from roughly 7% of GDP to about 3% by making adjustments to spending, taxes, and interest rates, big, painful disruptions will likely occur. - Ray Dalio
With the Big Beautiful Bill passing, national debt is forecasted to reach $40 TRILLION this year No end in sight - X user Kalshi


America’s M2 money supply has seen a recent surge. Are we surprised that USD has lost almost 11% of its value in 2025?

With a Federal debt wall of USD$7+ trillion, would USD’s value weaken over time? What should International investors do to manage the risk from such devaluation? Is diversification into different assets, markets a good way to hedge?
My final thoughts
The S&P 500 represents some of the top businesses from America. With global market accounting for a good portion of its revenue and profits, is there a strong correlation between the S&P 500 and the American economy? Is this a weakening correlation?
When the S&P just hit all-time highs but 60% of Americans are using Afterpay to buy groceries - X user BurryTracker
The ones who can afford to trade stocks and shares are not the ones who need BNPL to pay for groceries. Same world. Different reality.
It is possible for some income bracket group to do well while the other income groups suffer. While the recent S&P 500 peak brings excitement back to market, let us research before investing. There are different risk-rewards returns set against backdrops of different time horizons.
Let us review our expenditures, income, and savings. Let us spend within our means, invest with what we can afford to lose, and avoid leverage. I am reviewing my holdings and plan to cut losses with businesses losing their competitive advantages. I would also consider hedging and adding some defensive positions.
Let us do our due diligence before we take up any positions. Let us have a successful week ahead.